Cloud Desktop Pricing Index: $/CCU Across AVD, Windows 365 and WorkSpaces
Cloud desktop pricing pages are not designed to be compared. Each one buries the comparable number under a different set of assumptions: AVD assumes a session-host density and adds Microsoft 365 entitlements you might already own; Windows 365 prices per user-month with no density variable at all; Amazon WorkSpaces splits the SKU between Standard, Performance, Power, and the Graphics G4dn, G6 and G7 bundles with no obvious mapping back to anyone else’s tiers; and Windows 365 sells Business and Flex (formerly Frontline) on different terms again. Pulling them side-by-side is enough work that almost nobody does it more than once.
This post is the first quarterly run at a normalised index: the same hours per month, the same 4 vCPU / 16 GB profile for every dedicated desktop, and storage stated per offering, applied to three offerings at the list prices in force in Q4 2026. The intention is to repeat it every quarter so the trend line becomes the asset.
On this page
The normalisation rules
A pricing comparison is only useful if the inputs are pinned. Different inputs produce different winners, so a calculator’s defaults can pick the winner before you enter anything.
The rules for this index:
- User profile. 4 vCPU, 16 GB RAM, 128 GB OS disk. A representative knowledge-worker profile that maps to roughly comparable SKUs across all three offerings. AVD multi-session is the exception: users share a D16s v5 host (16 vCPU, 64 GB), so at 16 users each gets about 1 vCPU and 4 GB.
- Usage hours. 160 hours per user per month. This is an assumption, not a standard: it prices AVD hosts and WorkSpaces AutoStop as if they only run while users work, which means autoscale is doing its job. At 160 hours AutoStop is the wrong WorkSpaces mode: it breaks even with AlwaysOn at about 88 hours a month, so the AutoStop row shows the cost of picking the wrong running mode, not a realistic option for this profile.
- Region. Azure West Europe and AWS EU (Ireland), because EU regulatory pressure makes this the region most readers care about. Windows 365 uses Microsoft’s published US list price, so treat that line as the least region-specific number in the index.
- Storage. 50 GB of FSLogix profile storage per user on Azure Files premium, plus a 128 GiB Premium SSD (P10) OS disk per VM, billed for the full month. WorkSpaces uses its closest bundle, 80 GB root and 50 GB user volume. Windows 365 includes 128 GB.
- Licensing. Microsoft 365 entitlement assumed present (organisations on Windows 365 or AVD typically already hold this). Entitlements one offering bundles and the others do not are not valued separately; the caveat under the table covers what that leaves out.
- Density. For multi-session offerings, three density assumptions, 8, 16, and 24 users per session host, apply consistently. This is the variable that breaks comparison most easily, so each value gets a separate column.
- Concurrency. Windows 365 and WorkSpaces are priced per named user. This index assumes one named user per concurrent user. If you have more named users than concurrent sessions, the per-user lines rise in proportion and the AVD multi-session line does not.
The output is a $/CCU (cost per concurrent user) per month figure, with the region and density assumption named. CCU rather than per-user-month, because concurrency is what sizes a shared host pool.
The matrix
Three offerings, three density assumptions where they apply, and the 4 vCPU / 16 GB profile for every dedicated desktop:
- Azure Virtual Desktop, multi-session and personal. Compute priced from the underlying VM SKU, D16s v5 for multi-session and D4s v5 for personal (Dsv5 rather than Dsv6 because Dsv5 is priced in more Azure regions, 68 against 64), at the Linux rate, because Microsoft states that AVD VMs “are charged at Linux compute rates for Windows 11 and Windows 10 single-session and multi-session operating systems”. Storage is the FSLogix profile plus the OS disk.
- Windows 365 Enterprise, single-session, per-user-month, at the 4 vCPU / 16 GB / 128 GB tier that matches the profile.
- Amazon WorkSpaces, Power bundle, AlwaysOn and AutoStop. Standard and Performance are 2 vCPU bundles, so Power is the only one that matches this profile. The license-included Windows bundles run Windows Server, 2016 to 2025, not Windows 11. Windows 11 on WorkSpaces is bring-your-own-license only.
- Not in this run: Windows 365 Business and Windows 365 Flex (formerly Frontline). Flex lets you “share licenses among multiple workers, either across shifts or based on number of active users”, which needs its own concurrency model rather than a row that only looks comparable.
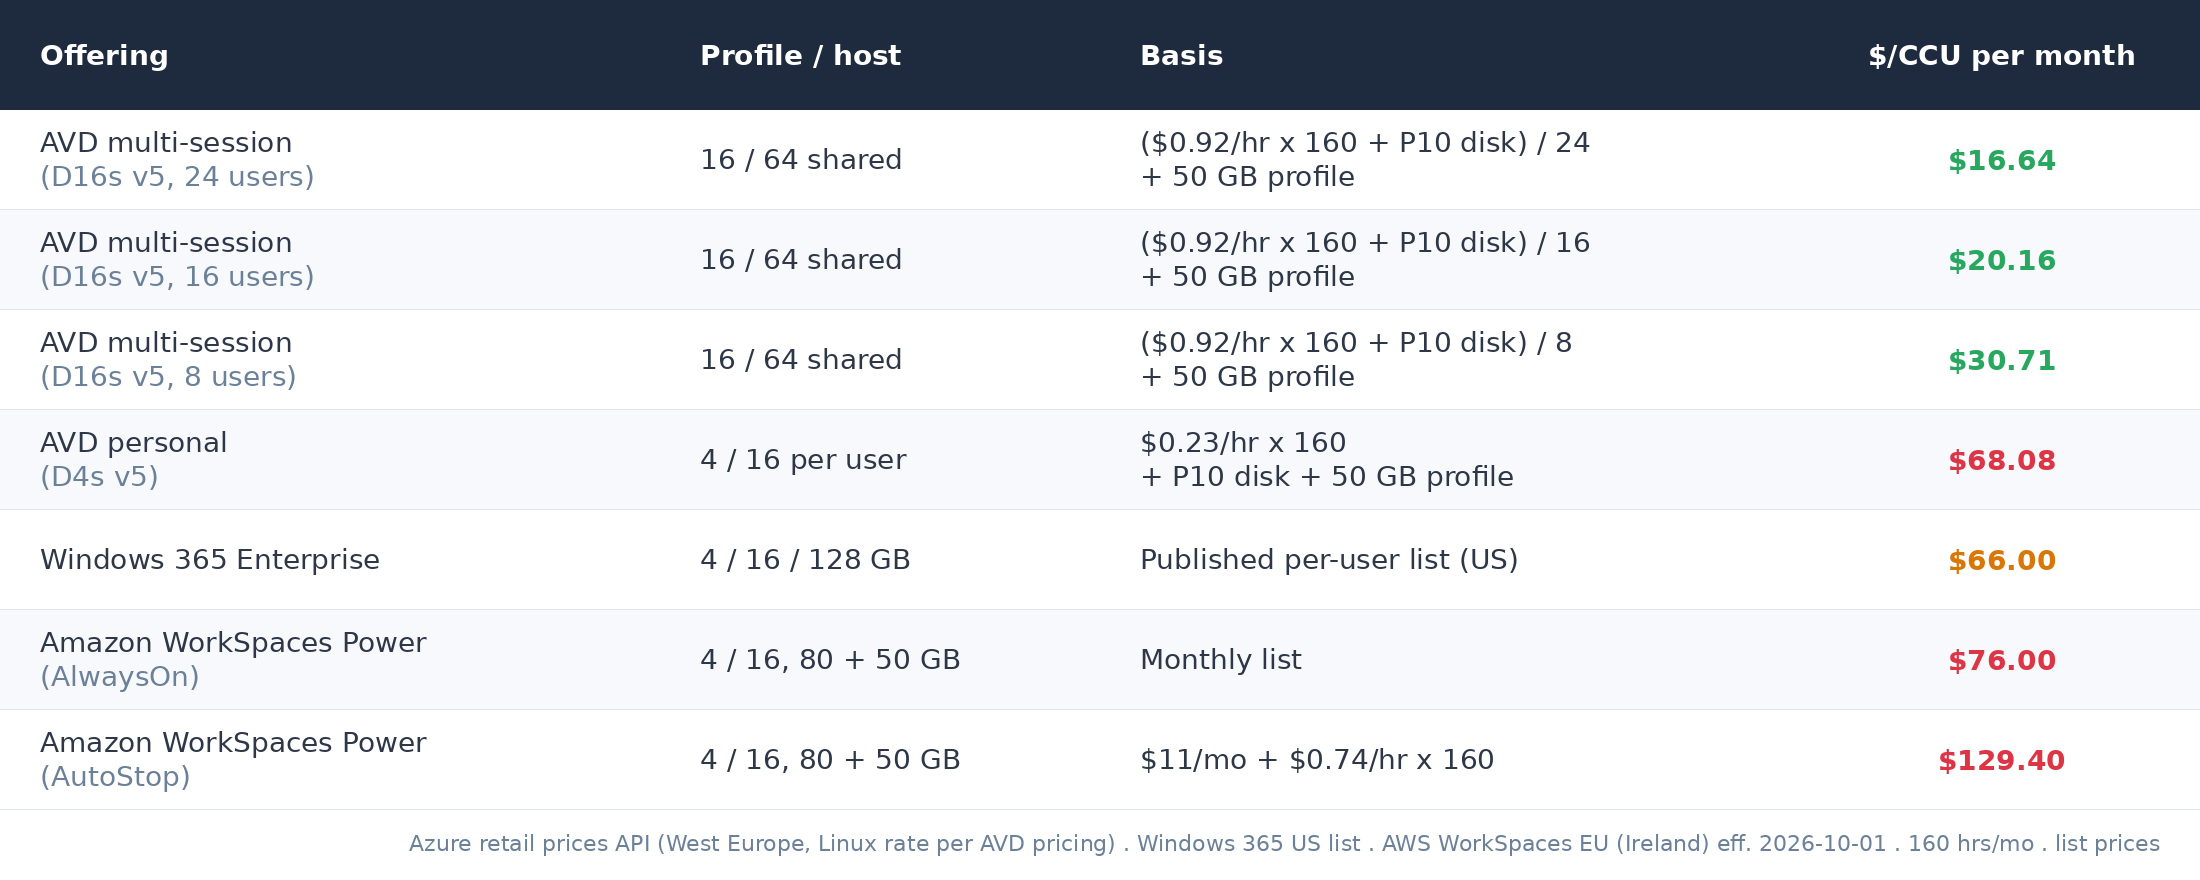
Every figure above is a published list price or arithmetic over one. Azure comes from the retail prices API for West Europe, Windows 365 from Microsoft’s published US per-user list, and WorkSpaces from the AWS price list effective 1 October 2026 for EU (Ireland). No commitment discounts are applied on any side.
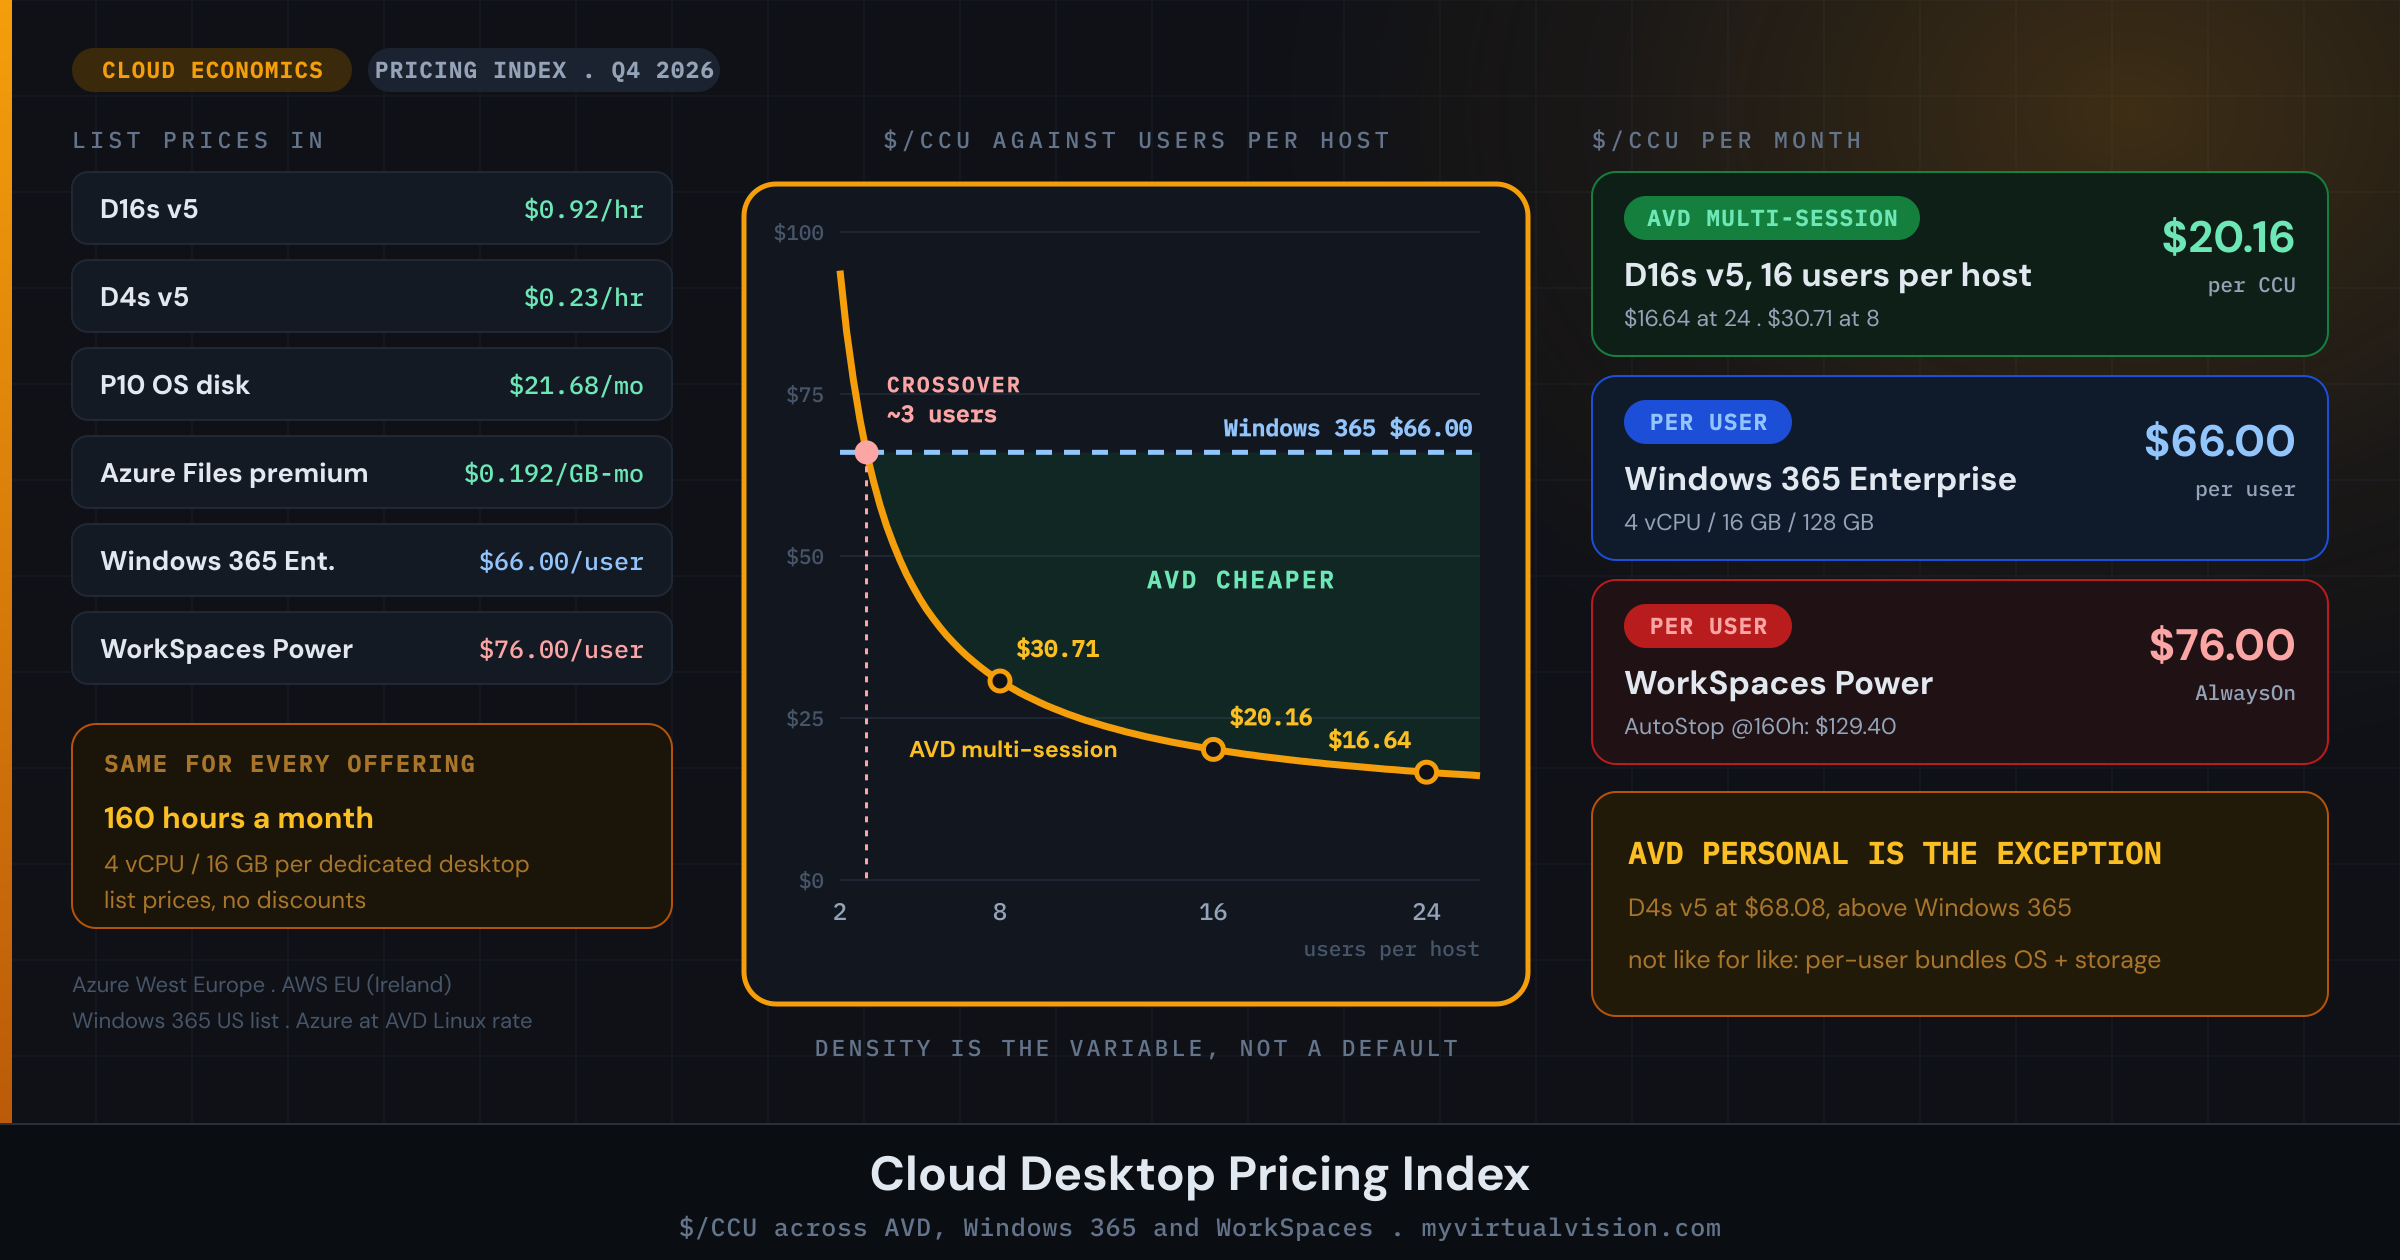
The result is less equivocal than I expected. AVD multi-session at 16 users per host lands at $20.16/CCU against $66.00 for a dedicated 4 vCPU / 16 GB Windows 365 Enterprise desktop, and the ordering does not flip at 8 users either, where AVD is still $30.71. On these inputs the crossover sits at about 3 users per host, below anything you would deploy. AVD personal is the exception: with its own OS disk it lands at $68.08, above Windows 365 Enterprise, so for one user per VM, Windows 365 Enterprise is the cheaper list price. The caveat is that this is not like for like: the AVD lines are compute plus storage, while Windows 365 and WorkSpaces fold the OS, the management plane and the storage into one per-user number. The gap is real, but part of it is scope rather than efficiency. The WorkSpaces rows also carry a Windows Server license you would not need with Microsoft 365 in place, and a different OS. Resources differ too: at 16 users per D16s v5, each multi-session user shares about 1 vCPU and 4 GB, against a dedicated 4 vCPU and 16 GB on Windows 365 and WorkSpaces.
Where calculators mislead
Three input choices move a pricing calculator’s answer more than the headline rates do. Knowing them is the difference between a credible comparison and a comparison that defends a pre-existing preference.
Density assumptions baked into headline numbers
Every AVD figure depends on users per host, and a calculator that shows a single density hides that. The density piece on this blog covers why a users-per-vCPU figure is a starting point rather than a plan. For comparison purposes, the fix is to expose density as a slider and report the result at multiple values.
Storage tier defaults
Profile storage cost in a real deployment is dominated by the tier the FSLogix containers actually need. Azure Files offers standard shares, backed by hard disk drives, and premium shares, backed by SSDs. Microsoft’s current guidance sizes the choice on concurrent users: HDD shares are acceptable for FSLogix below 2,000 concurrent users with light workloads or low concurrency, and SSD shares improve sign-in performance above that. This index prices SSD (premium) shares, the conservative choice for a knowledge-worker profile. Comparisons that default to standard shares flatter the offering that prices on storage and disadvantage the offering that bundles it.
Reserved-instance and savings-plan handling
Reserved instances and savings plans each carry their own commitment shape and break-even point. A calculator that applies the maximum reserved discount on one side and pay-as-you-go on the other is not comparing the same thing. Show both extremes and pick the realistic point in between.
$/CCU at three density assumptions
The single most useful chart in this index is the one that traces $/CCU across density assumptions for the multi-session offerings, with the per-user-month offerings drawn as flat lines for comparison.
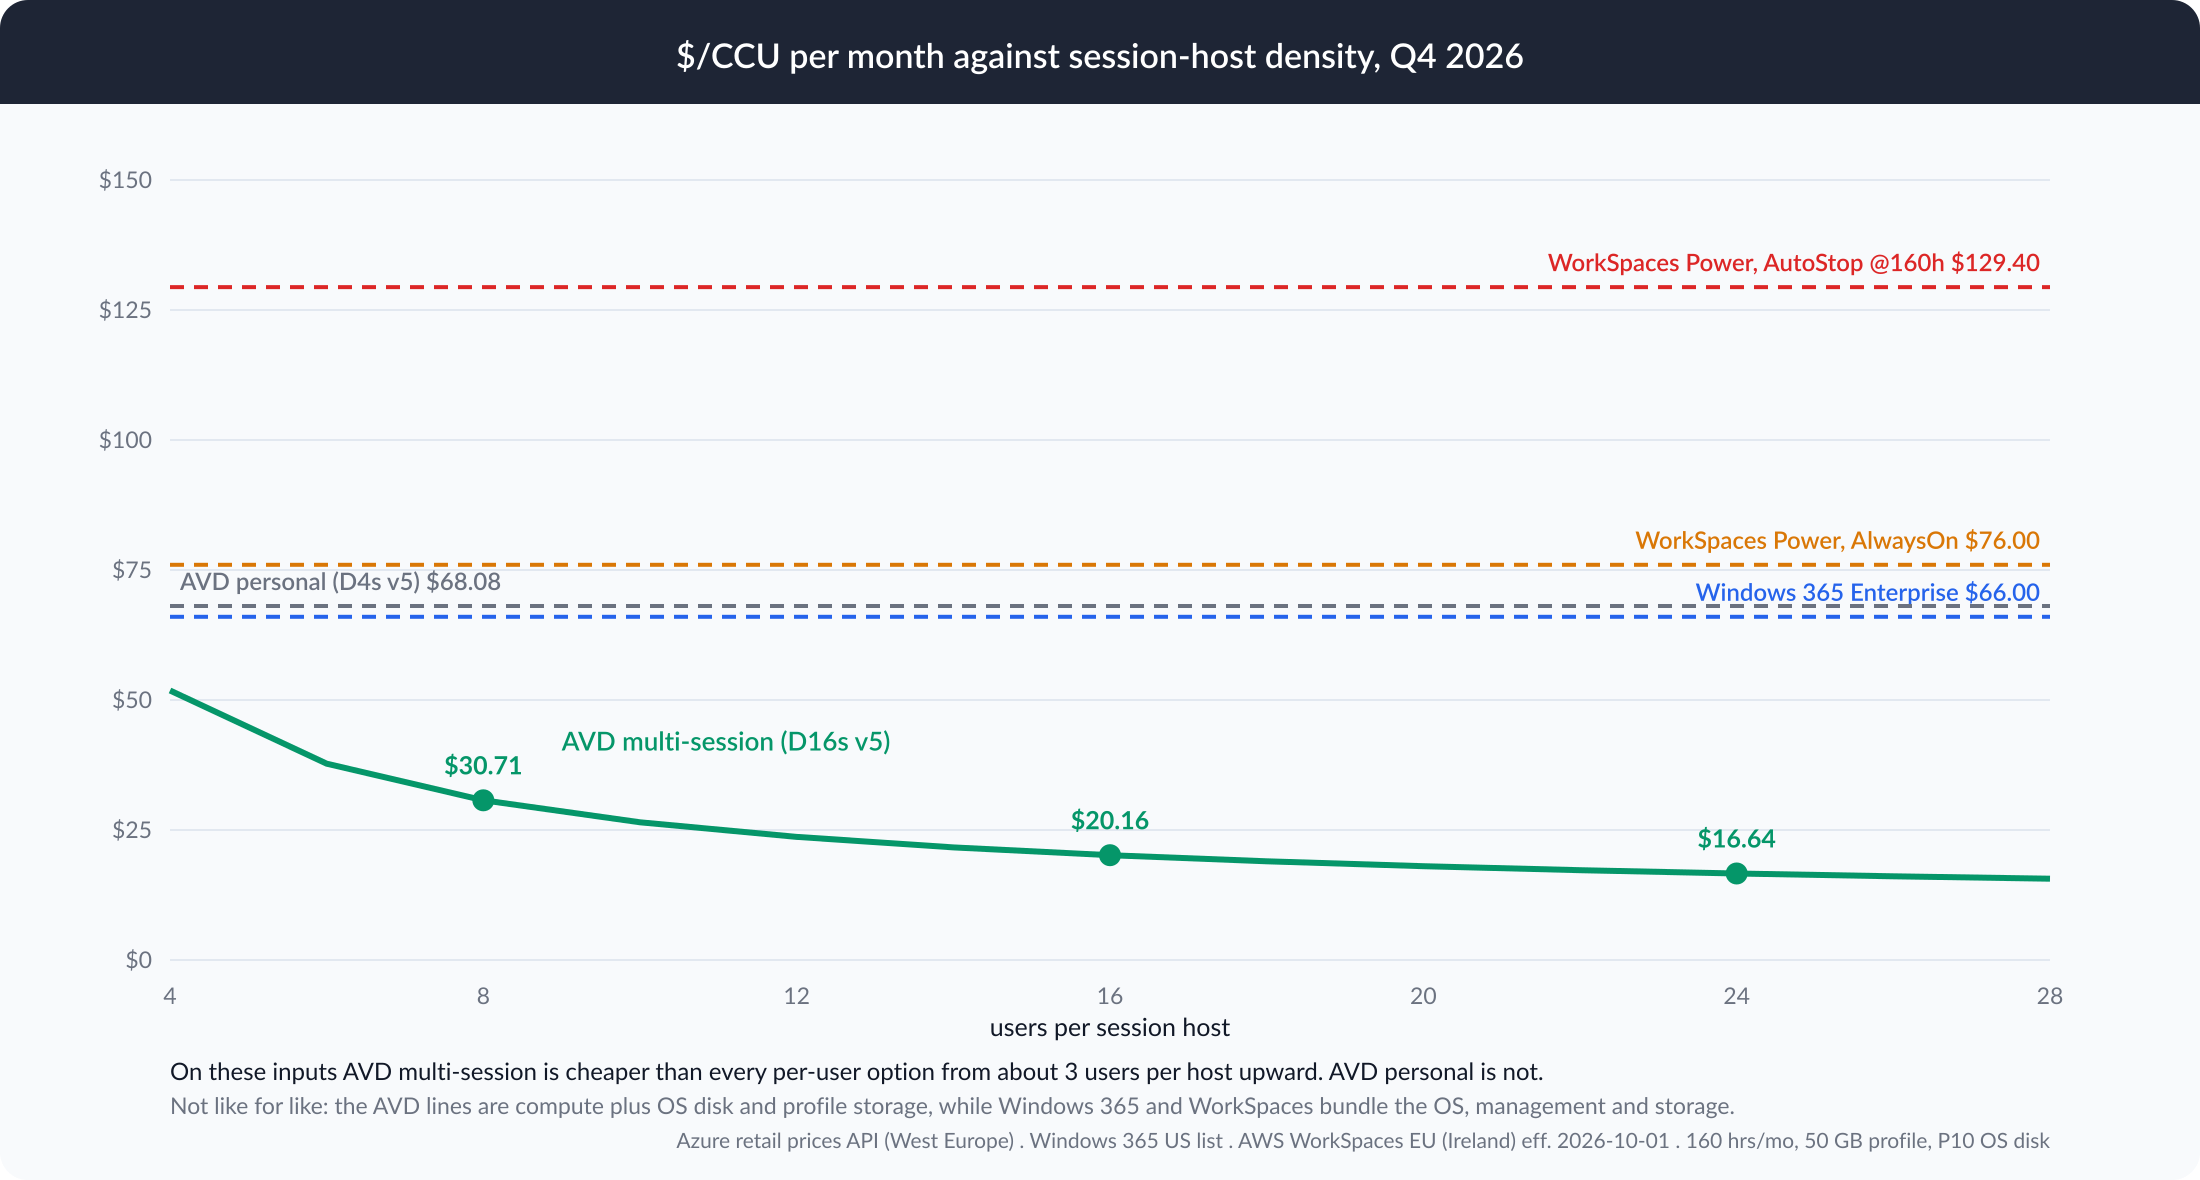
The shape of the curve is what matters. AVD multi-session falls steeply between four and twelve users per host and then flattens, so the saving is made in the first dozen sessions and the step from 16 to 24 users is worth $3.52 a head. The per-user offerings are flat by construction, which makes them the predictable choice rather than the cheap one.
For an EUC team planning a 2026 deployment, the chart answers “at what density does AVD become the cheaper option?” On these inputs: from about 3 users per host. So the real question is what the per-user offerings buy for their premium: a bundled OS, management plane and storage, no host pool to run, and a price that does not move with density. If that is worth the gap to you, the per-user offering is the right choice, but not because it is cheaper on list price.
Quarter-on-quarter delta
This run sets the baseline. From the next quarter, each run adds a delta chart against this one, so you can see which line moved and why.
Methodology and commitment
The methodology for this index is committed and reproducible. The inputs are the public list-price pages linked above and the normalisation rules at the top of this post. The derived storage inputs are a P10 OS disk at $21.68 a month and 50 GB of premium Azure Files at $9.60 a month per user. The rates in the table are the exact list rates, so a rebuild from the table reproduces the published figures. The intention is to re-run the same inputs each quarter and publish the result with the methodology unchanged.
The Bottom Line
$/CCU, normalised, repeated quarterly.
Cloud desktop pricing pages are not designed to be compared. Calculator defaults decide more than they show: density, storage tier and reserved-instance discounting move the answer more than the headline rates do.
A normalised index, run quarterly with the same profile, hours and storage rules, turns the comparison from list-price guesswork into landed cost per concurrent user. The answer is density-dependent for AVD and flat for the per-user-month offerings, which is why the right comparison is the curve, not the row.
For a 2026 EUC deployment, list price is not what decides it: on these inputs AVD multi-session is cheaper from about 3 users per host, a density any real deployment clears. The deciding question is whether the bundled OS, management and storage of the per-user offerings are worth the gap to you. AVD personal desktops are the exception: at $68.08 they cost more than Windows 365 Enterprise.
This is the first baseline run. The next lands with the same methodology and the first delta line. Bookmark the page; the trend is the asset.
If you have built a similar $/CCU model internally, which input moves your number the most when you flex it? Drop a comment below or find me on X at @kbaggerman.
Get new posts by email
One email when something new goes up. No schedule, nothing else.
Your address is only used to send these notifications. See the privacy policy.